

|
In this section we are going to dwell on the process of configuring a threshold for all types of SCADA Logs, including
The process of configuring thresholds for all types of SCADA logs will be shown based on the SCADA Status Log, taking it as an example.
For proper configuration of the SCADA Status Log, a user has to follow the steps bellow:
1. Create a data set containing all controller parameters having influence on the controller status.
2. Assign this data set to a controller property called SCADA log->Status log data set.
3. Configure a set of thresholds defining when and which status code has been set and reset.
4. Assign the threshold to the appropriate item from the data set created before.
More detailed instructions on configuring thresholds you can find below.
Configuring a threshold for SCADA Status Log
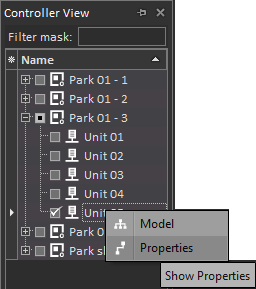
1. In the Controller View window decide about the unit which you will be working with, by selecting the appropriate check-box. Next, right-click the selected unit to access its Properties.
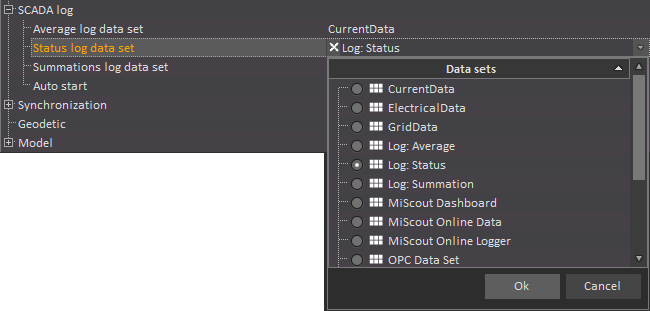
2. In the Controller Configuration window reveal the SCADA log node and specify the corresponding data set for the Log:Status data set field. You will be able to select the required data set from the revealed drop-down list.
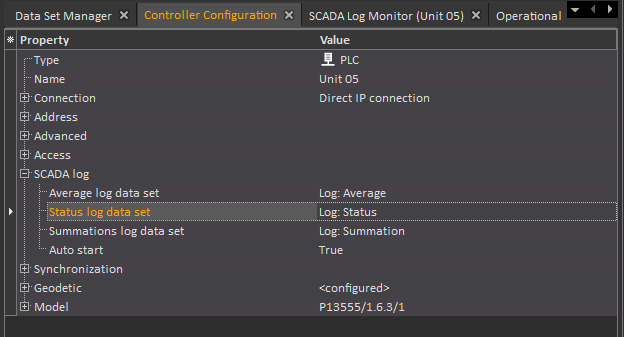
3. Put Auto Start into True by selecting the corresponding check-box. Otherwise, the status code condition and action will not be executed automatically.
4. Open the Data Set Manager tab and click the Show Data Set Manager icon on the toolbar. As a result, the Data Set Manager window reveals split into three sections: Data classes, Thresholds and Data sets.
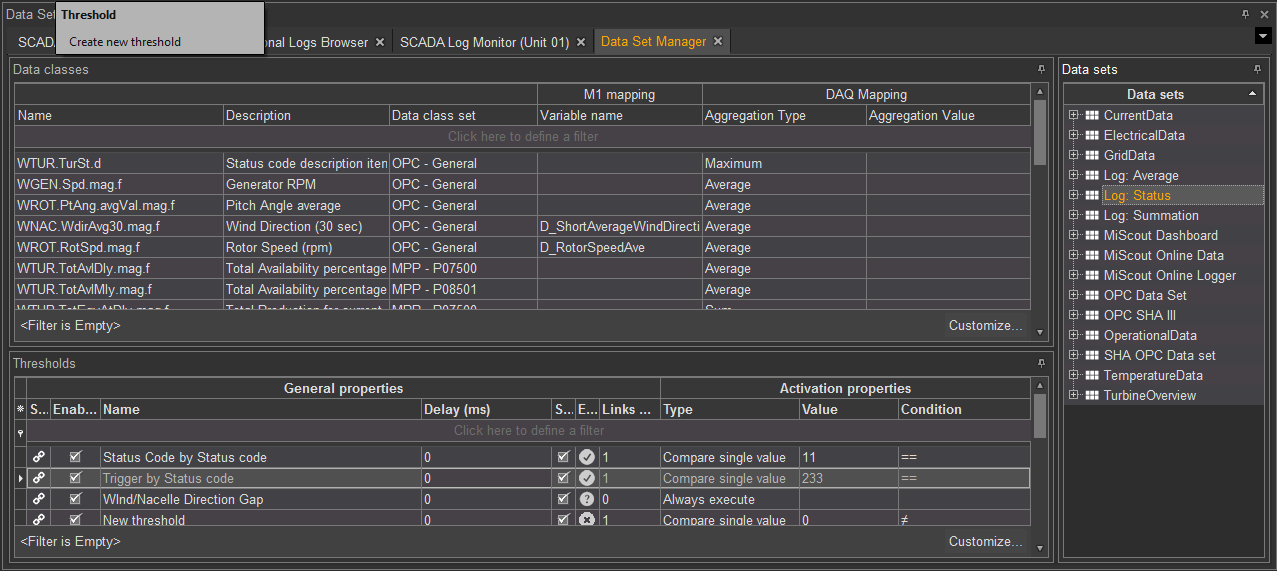
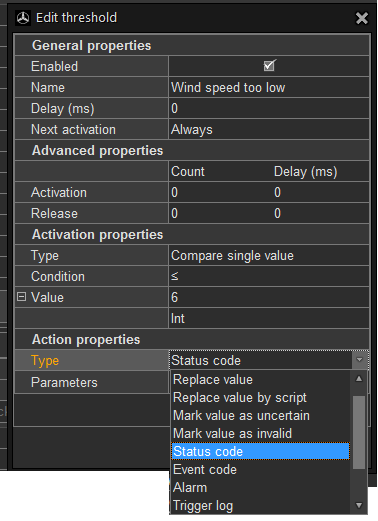
5. Click the Threshold icon in the New section on the toolbar to create a new threshold. As a result, the Edit threshold dialog appears allowing you to make proper configuration settings:
Important Note. Always execute must be used very carefully, as selecting this option for the threshold with a complicated condition could have a negative influence on the overall system performance.
Action Properties
As in our case we're dealing with SCADA Status Log, it is meaningful to select the Status code option from the drop-down list of the Type property field. This option is provided by MiScout SCADA allowing to set and reset the appropriate status code as soon as the input condition is true.
As seen on the screen above, apart from Status code, other options are also listed in the Type drop-down list, including:
When simple conditions are used for generating thresholds (e.g. status code setting, etc), it is recommended to select one of the above options. However, in case some more complicated conditions are applied for threshold generation, the configuration process differs. For more detail instructions, refer to Configuring Thresholds section.
Now lets' go back to configuring the "Wind speed too low threshold". On selecting the Status code option from the Type drop-down list, we have to specify the proper status code meant for setting/resetting. This can be done in the Parameter dialog.

Note. Status code number can range from 0 to 65535. If you enter the status code number already existing in the system, it will be displayed in the grid monitor just the way it is specified in Parameters. User is allowed to leave the statusText field empty, then MiScout will use the status code description from its own database.
6. Eventually, press the OK button in the Parameters dialog.
After pressing Ok, the newly created threshold will be listed among the available thresholds. Please note, that the icon of the new threshold is marked green.
7. So, click  Commit Changes to save new settings for the threshold, you've created recently.

Assigning a threshold to the data item
1. Now, go back to the Data Set Manager tab on the main ribbon and from the list of available Data Sets select the one which we have previously configured for this unit (see Step 2 for more detail information). In our specific case, we will select Log: Status.
2. In the Log: Status data set select the data item to which the selected status code (in our case it is Wind Speed) has to be assigned.
3. To assign the selected threshold to the data item, simply drag-and-drop the  threshold icon from the Thresholds window to the appropriate Data Item under the prior selected Data set node.
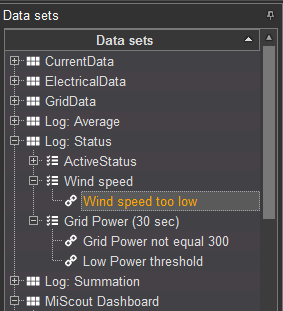
4.Finally, click  Commit Changes to save assigning of the threshold. In this way, a user can create a set of different thresholds each being responsible for the activation of a certain status code.
5. Click to open the SCADA Log Monitor tab on the main ribbon. Next, click New on the toolbar to open the SCADA Log Monitor in a new window.
6. To proceed, press the Start Service button to receive data values. As a result, our status code threshold will appear on the chart as a dotted vertical line. Last Values tab at the bottom of the Channels panel to the right will display the received value range for the selected data item.
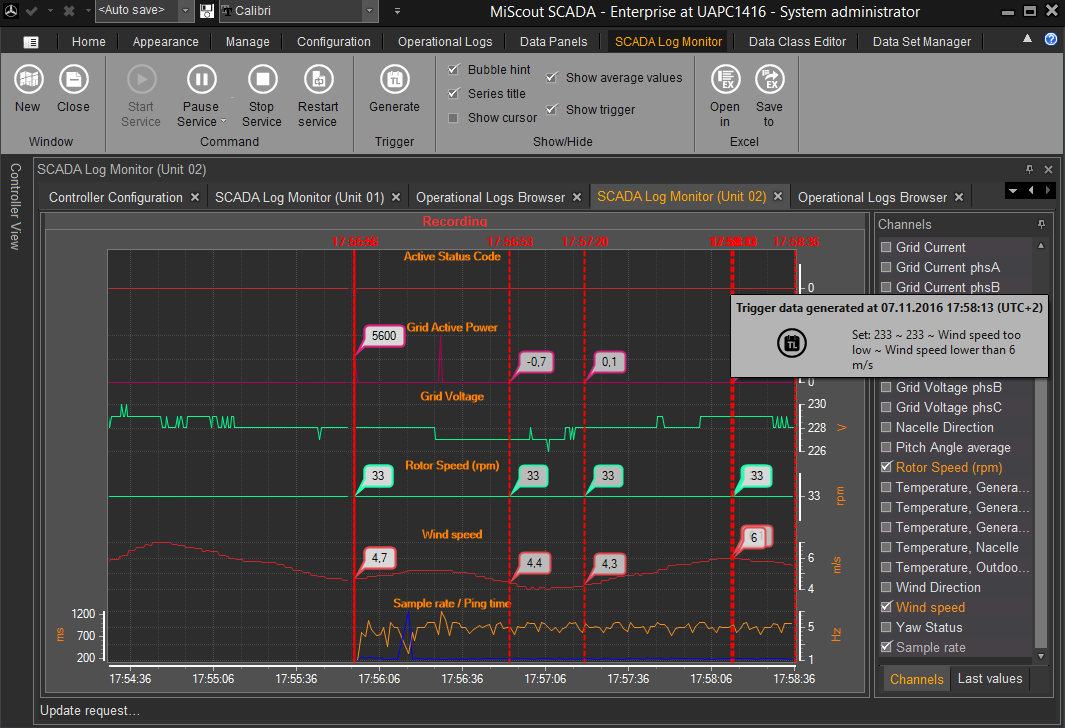
7. Go to the Operational Logs tab on the ribbon in the appropriate logs group (in our case it's a Status Code group) and click the SCADA log icon. The logs will be downloaded and will display information on values received for the selected data item as well as the status code setting/resetting time stamps.

Usually, Execute Script should be selected for Type filed in the Action properties section when configuring the threshold for affecting the SCADA Status Log. Next, user has to specify the appropriate script in the Value field. By default, MiScout provides the StatusCode.js script allowing to set and reset the appropriate status code when some input condition is fulfilled. Also, the status code meant for setting/resetting must be specified in the Parameters dialog of the corresponding script. For more detail information on scripts, refer to the Scripts View section.
Configuring a threshold to show exceeding of Warning and/or Alert boundary values
A special type of threshold can be created to show any exceeding of the boundary value ranges prior configured as Warning and/or Alert minimum and maximum values in the data mapping. An example of such preliminary data mapping configuration is shown below.
Pre-configurations in Data Class Editor
Prior to creating a threshold, first we have to find a data mapping corresponding to a prior selected data item. As in this specific example we're dealing with the VMP controller, we'll be searching the data mapping in the VMP - General mapping set. Once the data mapping is found, double-click it to open its Edit mapping(s) dialog and set the minimum and maximum values for Warning and Alert columns.
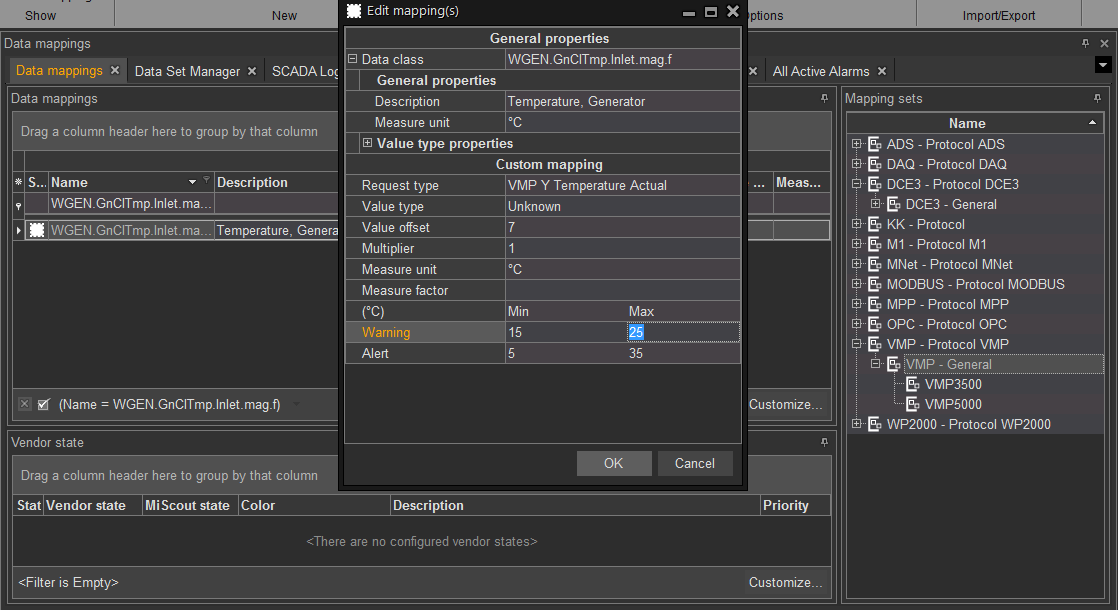
As shown in the screen above, we have specified boundary values for the generator temperature.
Configuring threshold properties
As soon as data mapping configuration is finished, we can move on to creating a threshold. For example, let's create a threshold called "Generator Temperature threshold" and configure it's key properties in the Edit threshold dialog.
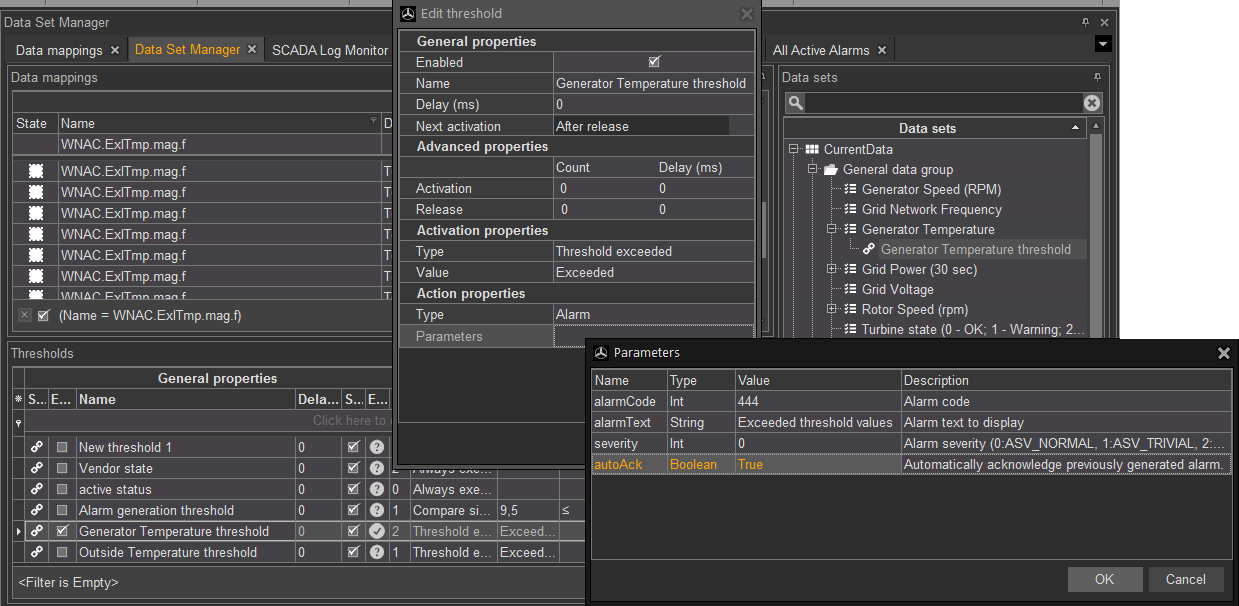
For the threshold to be able to "react" to any exceeding of the minimum/maximum values configured in the Warning/Alert fields, it must be assigned the "Threshold exceeded" type in the Activation properties section. For more detail information of this type of thresholds, refer to Configuring a threshold of the Threshold Exceeded type.
Activation properties
Note. Unlike Warning, Alert, Warning lower, etc. options, on selecting Exceeded, the threshold will be able to verify conditions configured both for Warning and Alert mapping fields.
Action properties
Finally, the Generator Temperature threshold must be assigned to the corresponding data item in Data Set Manager (in our example it's Generator Temperature).
Viewing channel Alert/Warning Min/Max values in SCADA Log Monitor
On completion of all the necessary configuration steps, you can launch SCADA Log Monitor for the corresponding controller by selecting the corresponding channel.
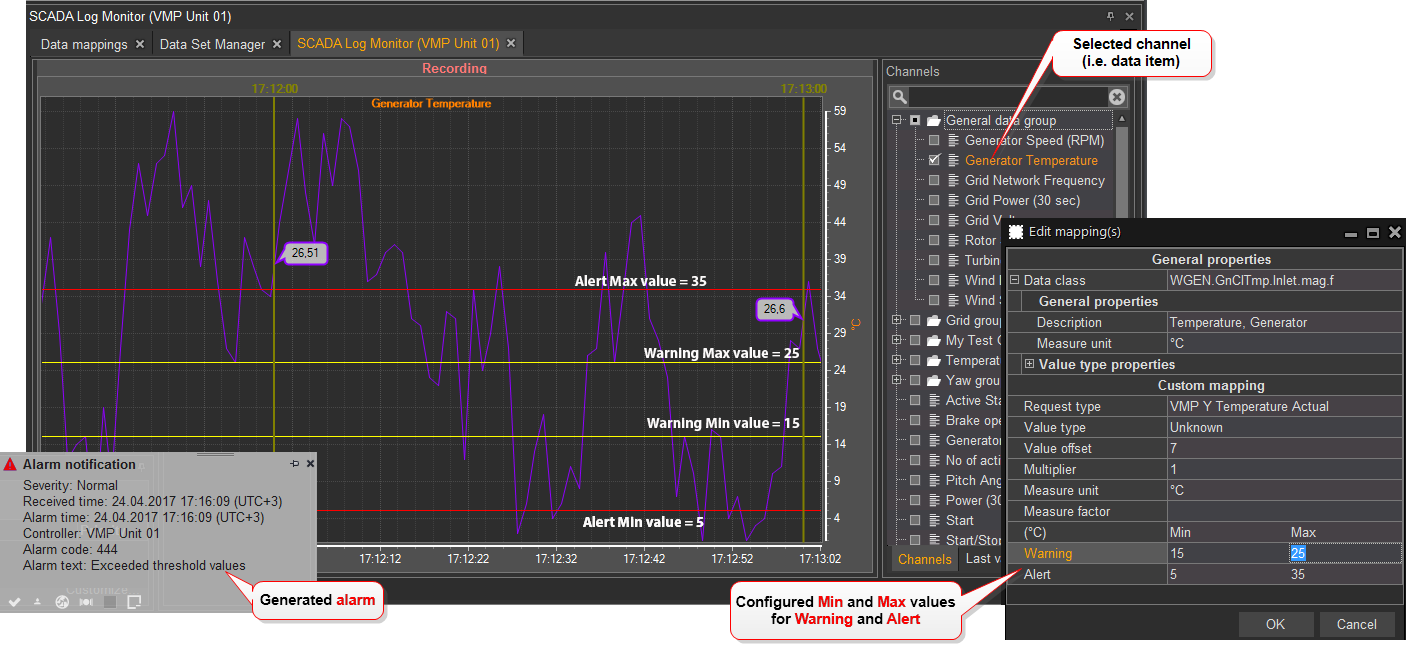
As soon as the threshold is activated, a user will be notified by a special alarm notification message. You can view all generated alarms with the help of the Alarms tab on clicking Active Alarms and/or All Active Alarms icons on the toolbar. Afterwards, the alarm will be automatically acknowledged by the system, so that it will be displayed in the History Alarms window.
